S&P500 index dropped 0.73% on friday — setting a negative tone for the Indian markets. Going by the same sentiment bank nifty opened gap down at 43455, made a long legged doji opening candle. The 2nd candle was red which would have prompted more traders to go on the short side.
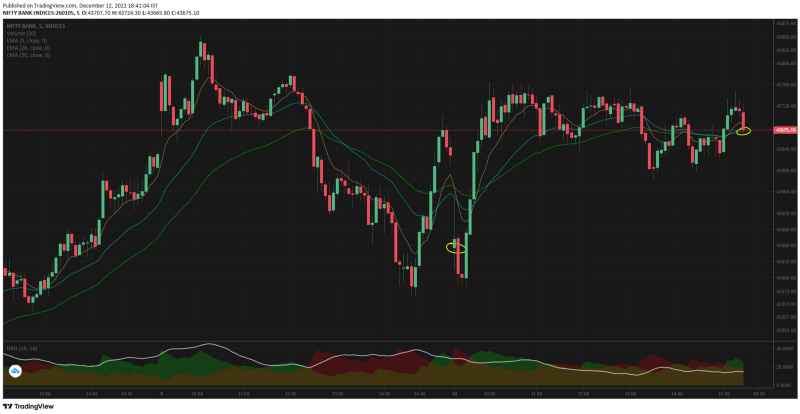
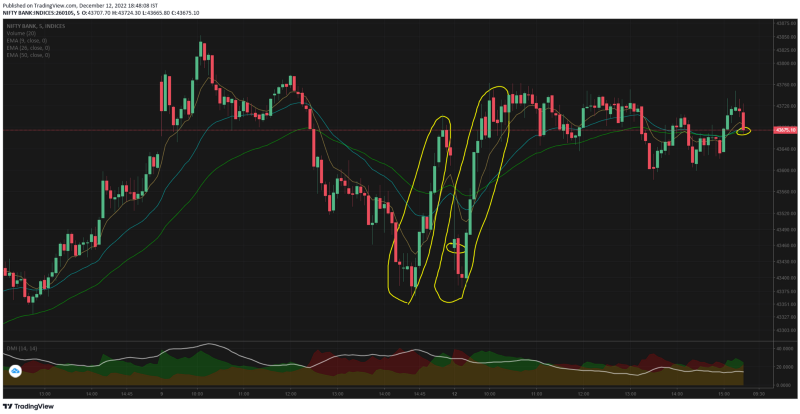
The manner in which bank nifty took support at the swing low of last session is like a fairy tale. The 1 hr of trade today and the last hour of trade friday was relatively same (see yellow marked regions). This may mean that the global weak sentiment had no effect on bank nifty.
The longs were still intact thats why the bank nifty recovered the gap down so quickly. But the news isnt that positive either. From 10.10 to close of day today — BN absolutely went nowhere.
There was an attempt to go lower from 13.15 to 13.30 — but this got quickly recovered again.
Nifty50 also remained flat, but NiftyIT saw the selling continuing and closed at 0.40% lower. Why would Indian stocks not respect the global macro trend is quite intriguing.
I personally felt not comfortable to take the trades after the opening 1 hour — mainly because of my bias from the global cues. I couldnt go short because the chart pattern was not confirming the trend and I couldnt go long as the macros were not in favor. So i just let the day pass by after the opening trades.
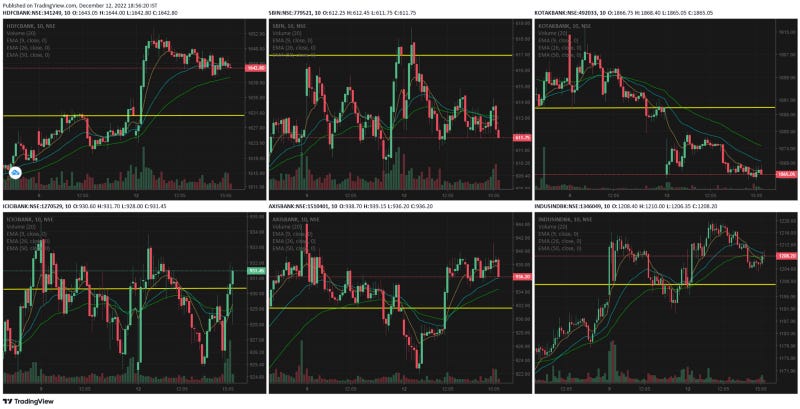
Of the bank nifty components:
-
HDFC bk chart pattern resembled the niftybank quite closely. The 1st hour of trade gave it strong gains and the remaining time was spent in consolidation
-
ICICI started dropping and was trading underwater till the last 35mts rally. The volume shows quite a surge in the last 30mts.
-
SBI started lower, went above the flat line and then gradually fell, but today's low has not taken yesterday's swing low.
-
Axis trend was supposed to be continuing (falling) but there were 3 strong green candles that took it above water.
-
Kotak had an island day, gap down opening, a failed attempt to close the gap and the final close near the day's open.
-
IndusInd had some strong greenish moves at 10.35 and then it took out the swing high of last session. Final close was almost mid way between the HOD and flat line.
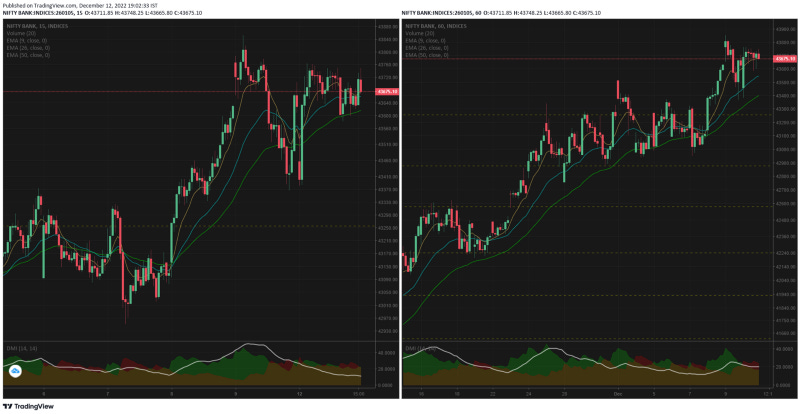
15mts chart shows the inability to take out the previous swing high, until which we cannot be outright bullish. We cannot be bearish too unless the nearest support is taken out
1hr doesn't show any clear direction yet — may be looked at as a consolidation period.
PS: Read the standard disclaimer at: https://bit.ly/3Nm3RER
I am not a SEBI registered analyst — the views are for educational purpose only
Comments
Post a Comment