If we look at the 5mts chart of bank nifty, apart from the opening 30mts of volatility — we had a smooth day of trade today.
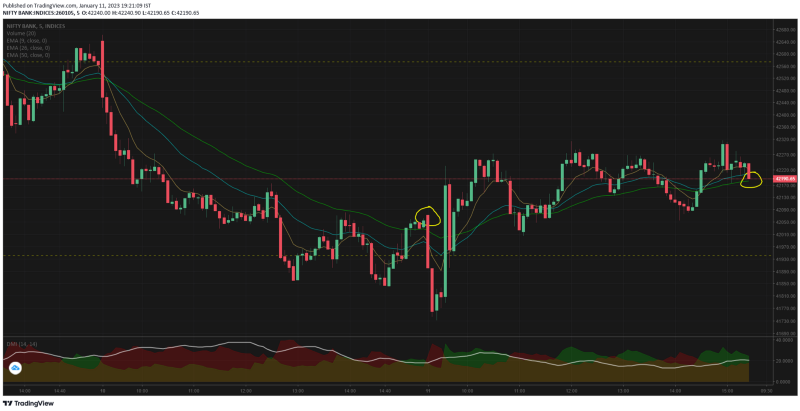
Inline open at 42071 and dip below the support level by 09.20, the next candle perfectly closed below the SR and might have indicated further pain ahead. The option premiums even indicated that the market may fall further — but quite surprisingly that did not happen.
The single candle at 09.35 took BN 442pt ~ 1.06% up breaking through the resistance level of 41940 & negating the opening price action.
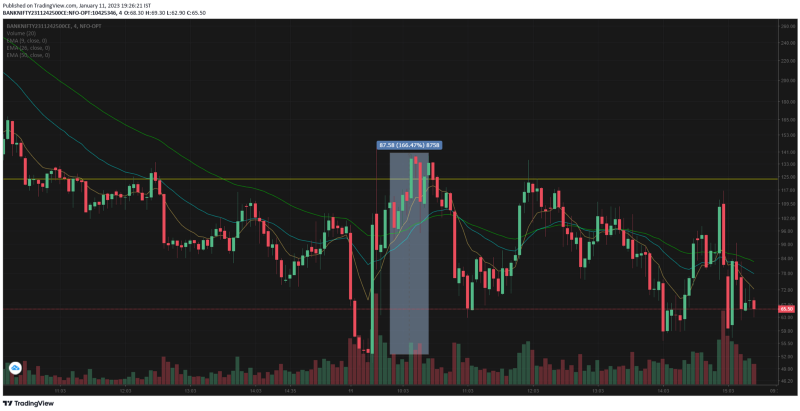
Take a look at the 42500 CE, it went up 166% in a span of 25mts indicating the shorts are getting covered. We had discussed the possibility that today's price action may contradict yesterday's move if it was a FINNIFTY expiry positional build up.
Now today has set the tone for tomorrow's bank nifty expiry. Its become an easy target to swing the top 6 banks of India one way on tuesday and counter move it on thursday — ensuring that technically with zero price move a ton of money can be made.
If NSE does not stop this — a handful of traders will be able to mint money as easy as blinking.
Well who am i to suggest??
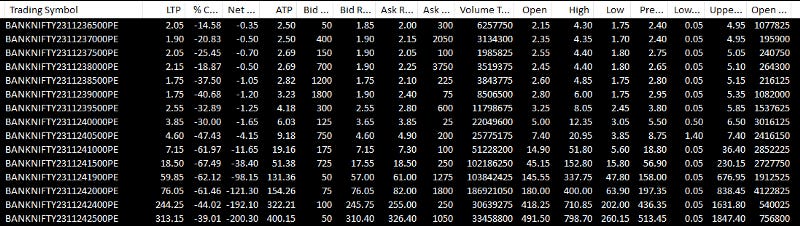
The option premiums of PE is suggesting that bank nifty may move up tomorrow — but the premiums alone cannot be read in isolation as people will abandon position when market moves against.
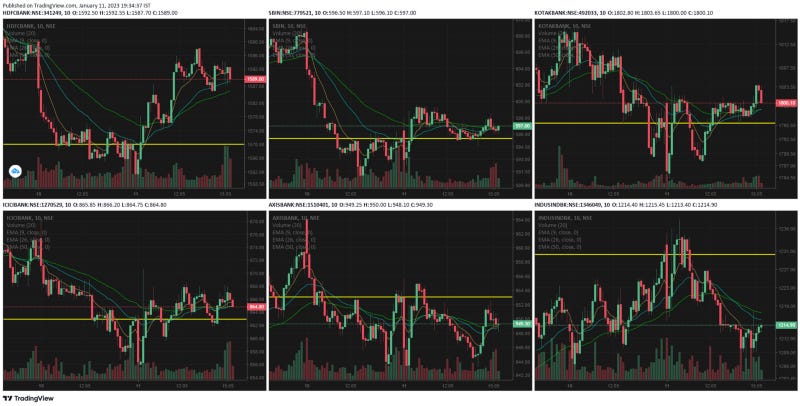
Among the bank nifty components
-
HDFCBk moves sharply against yesterday's move. almost retracing 100% at 13.15 but gave up some gains towards the close
-
ICICI Bank did not attempt to negate yesterday's rally instead it chose to stay above water flattish.
-
SBI also did not counter move to yesterday, but the price action seemed flattish
-
AXIS bank showed negative price bias today continuing the price action from yesterday.
-
Kotak had an inverted U shaped pattern 09.25 to 11.25 showing bearishness, but the final close was in green.
-
IndusInd the lone wolf yesterday did not put up a fight today & kept its head below water — probably conserving energy for further moves.
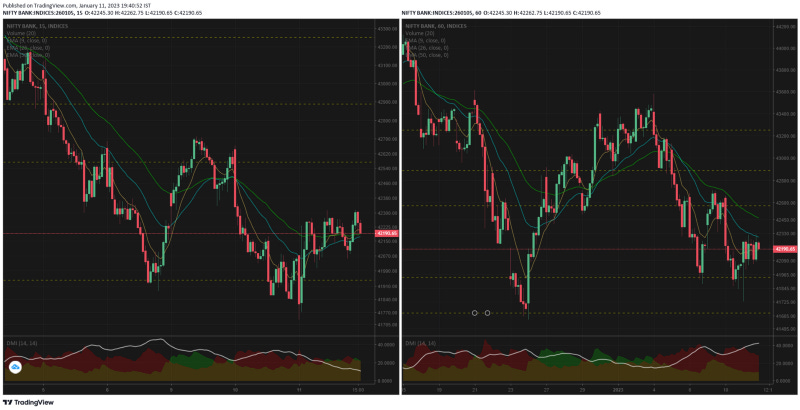
15mts is not showing bearishness until the recent swing low is taken out. As it stands it shows a sideways market
1hr chart has a higher probability of going bearish because the recent swing high is still not taken out — which means we are still expecting a lower low formation soon.
Comments
Post a Comment