Bank Nifty Today — 29MAR 2023 Post Mortem & Weekly/Monthly/Yearly Analysis
Quite an eventful day today spoiled by the last 30mts surprise. Honestly how many traders were expecting a rally of 340pts between 15.00 to 15.30 — i was not. In fact i was expecting a fall towards the 39400 levels.

Lets analyze the trades on the 5mts chart today. Open was inline at 39611 and we tested the resistance level of 39742 in the opening minutes itself.
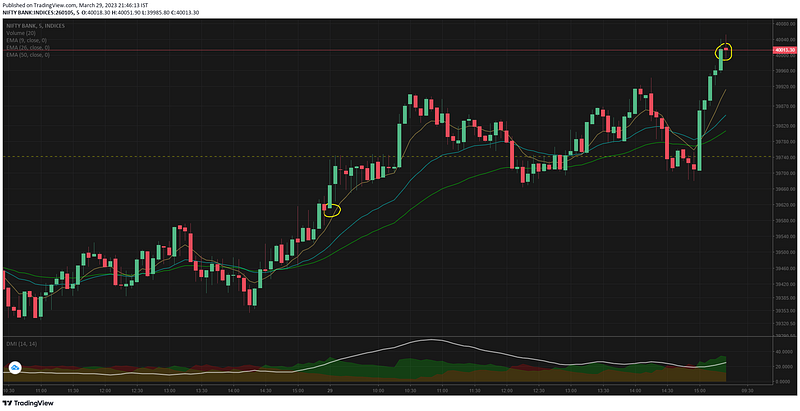
We spent an hour at this support/resistance zone before breaking out. Although the break was temporary.
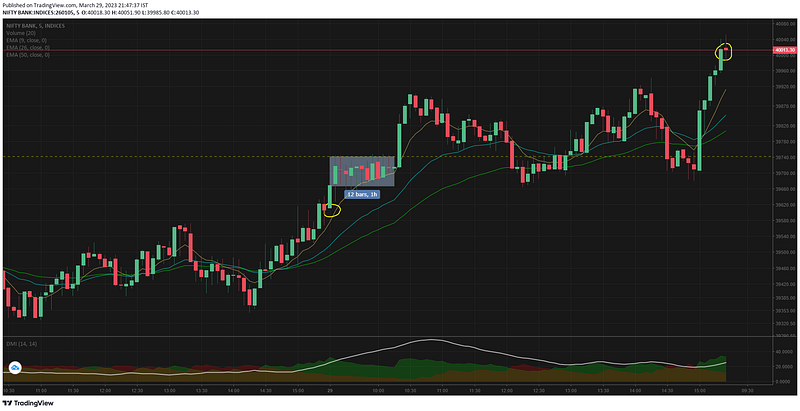
At 10.20 i posted on banknifty minds "$BANKNIFTY 39744 if it breaks will give a good push to CE option premiums hoping so !"

TradingView India. View live NIFTY BANK chart to track latest price changes. NSE:BANKNIFTY trade ideas, forecasts and…in.tradingview.com
The rationale of the breakout would be due to the strength bank nifty showed defending lower levels in the opening hour. This would have prompted CE shorts to cover their positions at profit/loss. Why am i saying this — i covered mine at a loss well before 10.00.
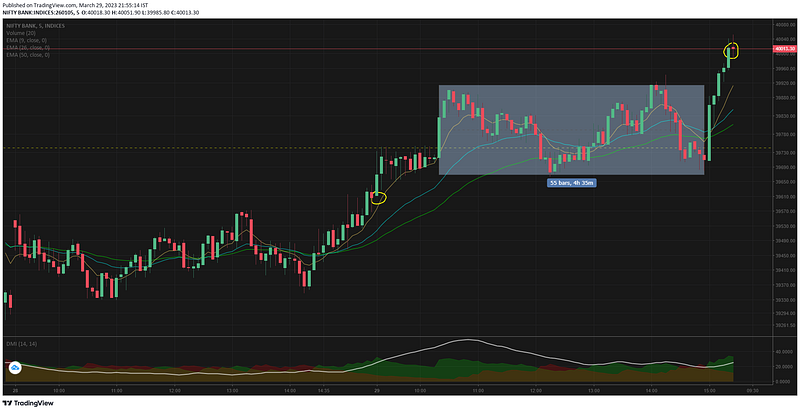
The candle at 10.20 made a surge of 109pts ensuring 40000 CE jump 171% in the same 5mts. During expiry trading — option buyers are looking for these kind of opportunities & the sellers running away from it.

This spike above the resistance did not last that long and we reverted to the mean level in some time. The next 4h 35mts were spent between 39668 & 399913 with no directional bias.
At 13.47 i felt that bank nifty will fall below the SR level looking at the price action and posted this "$BANKNIFTY struggling to go up even after the resistance breach for me thats negative !"

TradingView India. View live NIFTY BANK chart to track latest price changes. NSE:BANKNIFTY trade ideas, forecasts and…in.tradingview.com
From that point till 14.55 my analysis was going in the right direction. I had also taken a bearish bet of 39400/39300 debit spread to capitalize my view (which went to zero at last).
Honestly i was not at all planned for the last 30mts move. A surge of 343pts in 30mts that too with huge volumes.
"$BANKNIFTY sorry had no clue about this last 15mts candle with exceptional volume spoiled the party !"
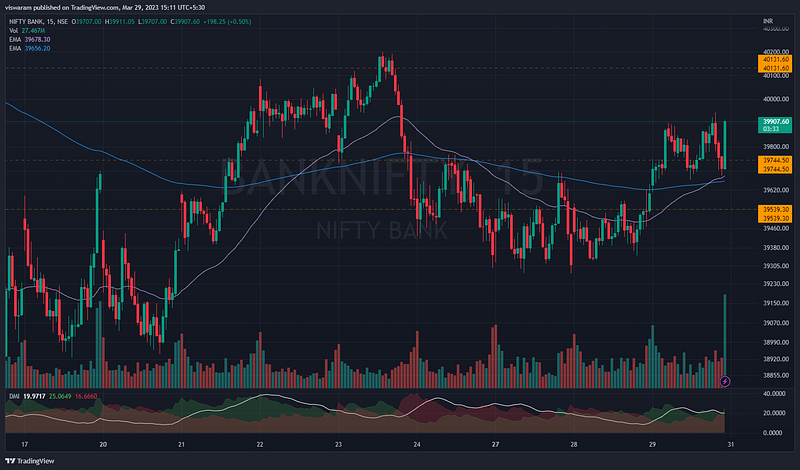
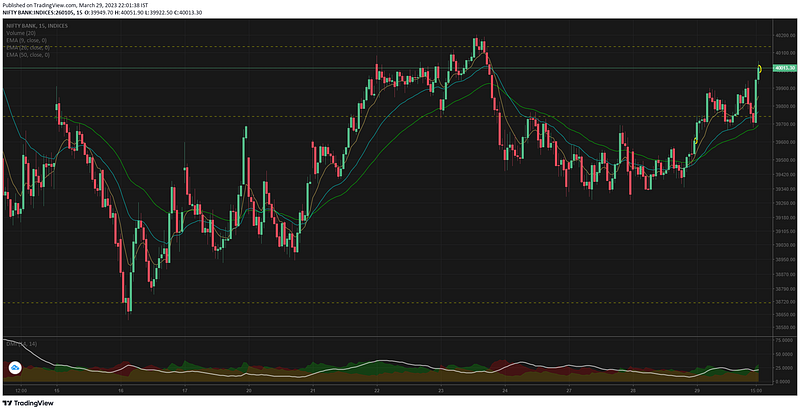
What the last 30mts did today was to give the 15mts TF a new bias change, all of a sudden the chart is now not looking bearish at all. If we take out the next resistance the chart will go bullish too.
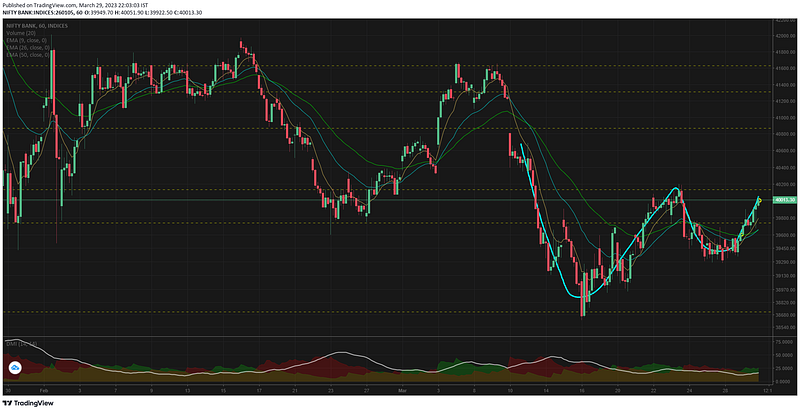
1hr TF shows a W like pattern forming, if we take out the next 2 resistance over the next 3 to 4 sessions — then the chart will lose its bearish view and go back to the range based territory.
The volumes on the major banks in the last 30mts which caused a huge surge in the prices may have been year end rebalancing or expiration trades. There are big institutions that take bets even for a year, for eg: the positions for closing of FY22–23 series would have been taken in FY21–22 itself. Since today was the last day of the fiscal series (expiry today).
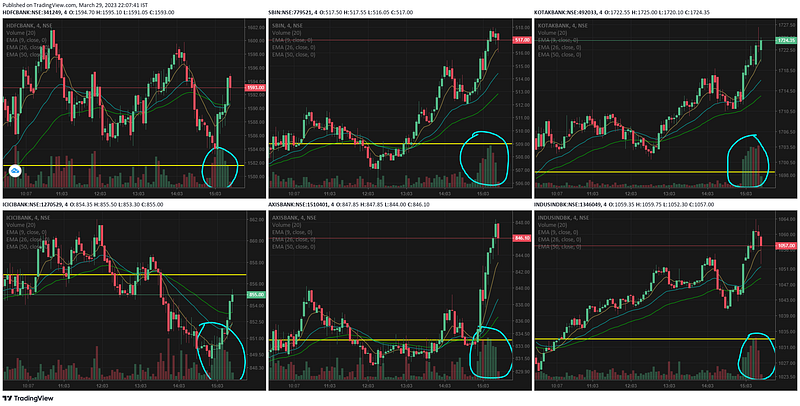
See the cyan markers for the unusual volumes in 6 bank nifty stocks.
Comments
Post a Comment